Select Page
Fishbone diagram
Dr. Kaoru Ishikawa, a Japanese quality control statistician, invented the fishbone diagram. It is often also referred to as the Ishikawa diagram. The fishbone diagram is an analysis tool that […]
Dr. Kaoru Ishikawa, a Japanese quality control statistician, invented the fishbone diagram. It is often also referred to as the Ishikawa diagram. The fishbone diagram is an analysis tool that provides a systematic way of looking at effects and the causes that create or contribute to those effects. Because of the function of the fishbone diagram, it may be referred to as a cause-and-effect diagram. The design of the diagram looks much like the skeleton of a fish. A cause-and-effect diagram can help identify the reasons why a process goes out of control. Often the fishbone diagram can be used to summarize the results of a brainstorming session, identifying the causes of a specified undesirable outcome. It helps to identify root causes and ensures a common understanding of them.
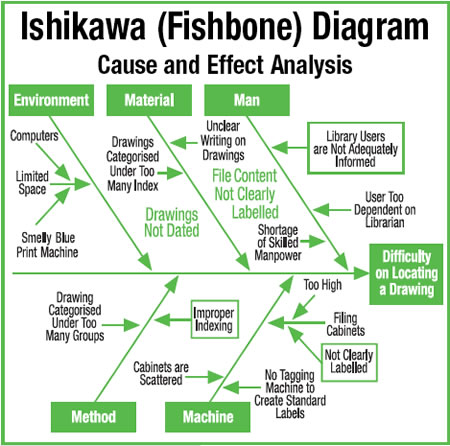
Cause-and-effect relationships govern everything and are the path to effective problem solving. By identifying causes, we can find some that are within our control and then change or modify them to meet our goals and objectives. By understanding the nature of the cause-and-effect principle, we can draw a diagram to help us solve everyday problems every time. Below is an example of use of an Ishikawa diagram to solve a difficulty in locating a drawing.