Select Page
Process visualization and cost reduction through MFCA
A simplified MFCA version makes it easier for SMEs to benefitAlex Yap
At present, SMEs generally face pressure to improve production efficiency, reduce environmental impacts, and lower operational costs. Material flow cost accounting (MFCA), a Green Productivity tool that simultaneously enhances productivity and environmental performance, can help SMEs improve economic and environmental performance.
MFCA was originally developed by the Institut für Management und Umwelt, Germany, and introduced to Japan in 1999. Under the Ministry of Environment and Ministry of Economy, Trade and Industry (METI), MFCA developed rapidly in Japan. In 1999, METI started its Environmental Management Accounting Project with pilot studies in selected Japanese companies which demonstrated the effectiveness of MFCA. The MFCA Prize was launched at the 2006 Eco-efficiency Forum. Japanese initiatives to make MFCA an international standard resulted in the publication of ISO 14051 in 2011.
After the release of ISO 14051 and promotion by the Asian Productivity Organization (APO), research on applications of MFCA reached a peak. Nevertheless, difficulties in calculation and data collection remain major challenges to SMEs trying to improve performance with MFCA. A simplified version of MFCA which involves visualizing the flow of resources in a “single quantity center” to initiate subsequent cost reduction activities was therefore developed specifically for SMEs with very limited resources.
Process visualization approach
Adopting the key principles of MFCA such as linking monetary data and attributing costs to physical material losses (Figure 1) help organizations determine the cost of waste generated from routine operations. Information visualized in both volume and monetary terms then serves as motivation for and raises awareness of cost reduction initiatives.
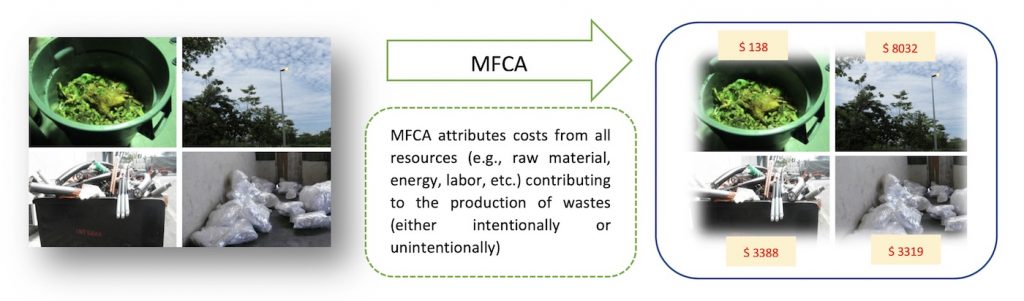
Figure 1. MFCA method assigning costs to all elements (raw material, energy, labor, etc.) contributing to the intentional or unintentional production of waste.
To determine areas with high waste value, a flow model is established for a selected product. The tangible volume of all required inputs such as raw materials, electricity, direct labor, chemicals, packaging material, etc. is traced through all stages of production processes with the fundamental “mass balance” elements of MFCA.
The cost of resources is allocated according to the ratio of positive product and waste, which is referred to as “negative product” in the context of MFCA. The MFCA flow model helps visualize resource flows in both quantitative and monetary terms and pinpoints areas for improvement with estimated values resulting from improvement action implementation (Figure 2).
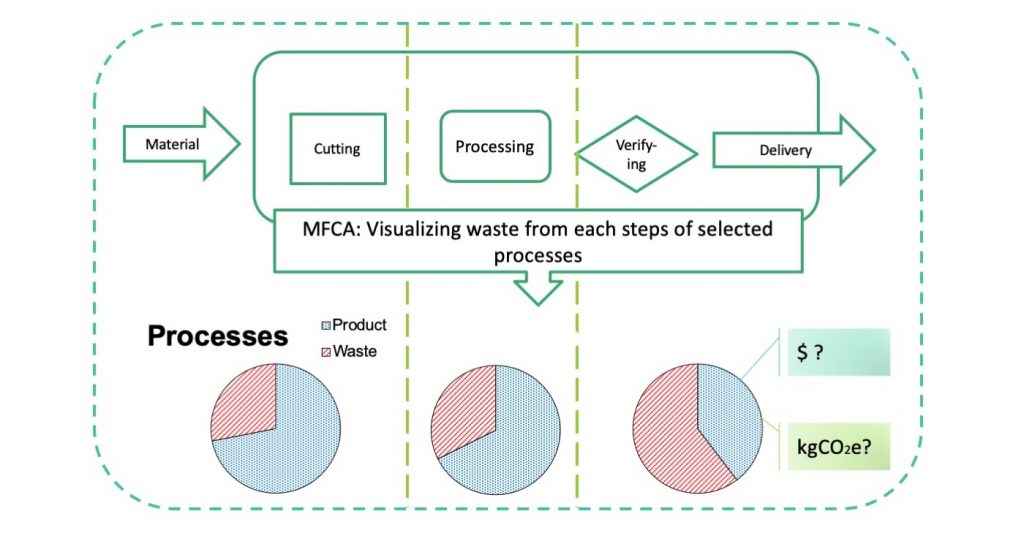
Figure 2. Visualizing waste from each process step in the MFCA approach.
Simplified process visualization approach
The MFCA process visualization approach can easily be simplified to adjust to the situation of most SMEs that lack the historical data records needed for MFCA calculation. The visualization process can be based on a single quantity center representing overall operations utilizing only one month of data (Figure 3).
The simplified single quantity center can be established within a short time to convince the management of SMEs of the potential monetary savings from negative products or waste. If costing information such as unit prices of resources is not available, estimations based on average market rates can be used for MFCA calculation, which also overcomes the typical challenge of costing information restrictions in most SMEs.
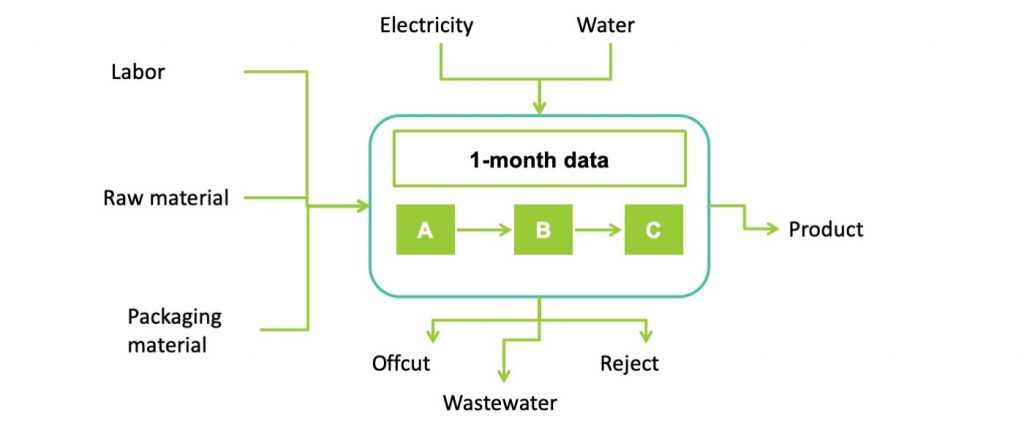
Figure 3. MFCA visualization process based on a single quantity center representing overall SME operations.
However, MFCA efforts in more established organizations can still rely on the structural plan–do–check–act sequence steps. MFCA implementation can therefore be divided into the seven implementation steps illustrated in Figure 4 in both large enterprises and SMEs.
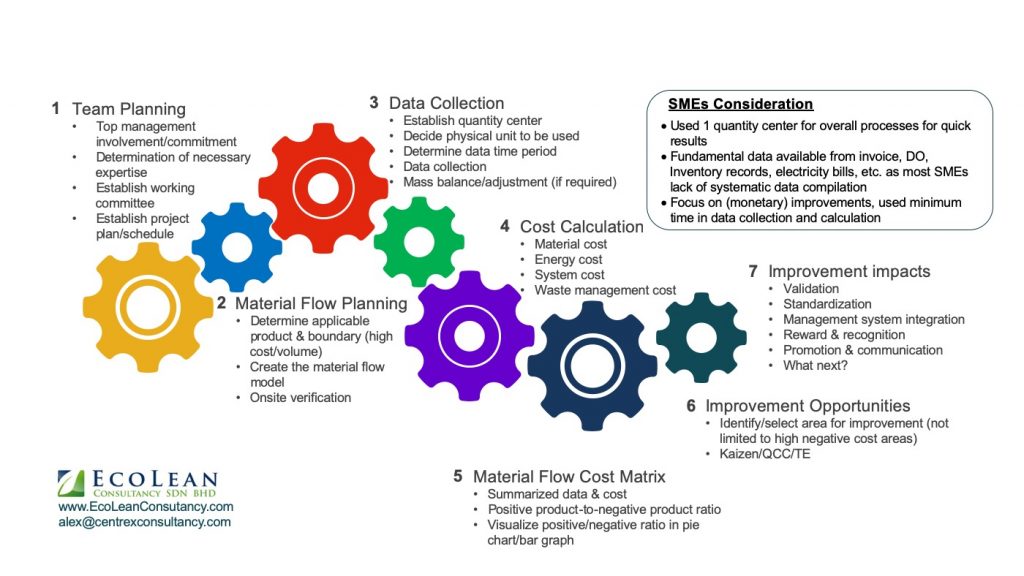
Figure 4. Seven implementation steps of MFCA.
- MFCA team planning
In the initial step of MFCA implementation, the top management should be briefed on the approach and expected outcomes to gain its commitment. Clearly defined roles and responsibilities of participating members are necessary to ensure successful implementation of MFCA. It is useful to appoint a working committee in implementing MFCA projects.
- Material flow planning
The MFCA committee determines the target products/processes and project boundaries to create the material flow model. This involves identifying the positive and negative products in each step of the processes (or in a single quantity center in the simplified version of MFCA for SMEs) within the boundaries.
- Data collection
Various processes or steps identified in the material flow model are defined as quantity centers, and the concept of mass balance is applied to each. Before the initial data collection, the physical units of each material must be defined.
- Cost calculation
The material flow matrix template in Excel spreadsheet format is useful for cost calculations. Users input the information on material used with cost allocations for energy, the system, material, and waste management.
- Material flow cost matrix
The material flow cost matrix shows the relative costs of both positive and negative products at a glance. It is used as a communication tool by:
• management to support decision making; and
• employees to visualize the changes to be made to reduce the negative product percentage.
- Improvement opportunities
Loss analysis is conducted to identify negative product costs by breaking them down into:
• types of negative product; and
• each individual quantity center
Subsequent improvement activities such as quality control circles (QCCS), kaizen, or Six Sigma can then focus on the loss analysis results. - MFCA improvement impacts
The final step is the integration of MFCA into existing organizational management systems such as ISO 9001 and ISO 14001 to ensure sustainable continual improvement activities in cost reduction, environmental performance, or even as part of the organization’s corporate social responsibility activities.
Successful examples of simplified MFCA adoption
Example 1
Brake lining manufacturer Company A achieved significant cost savings as well as better environmental performance after introducing MFCA.
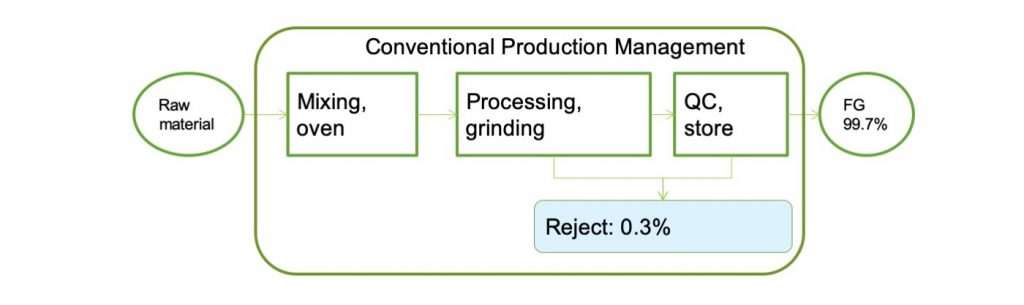
Figure 5. Conventional production manage system adopted by Company A before MFCA application.
Prior to the application of MFCA, the management team of Company A believed that the existing production processes had a very low rejection rate of 0.3% and therefore little could be to improve operations (Figure 5).
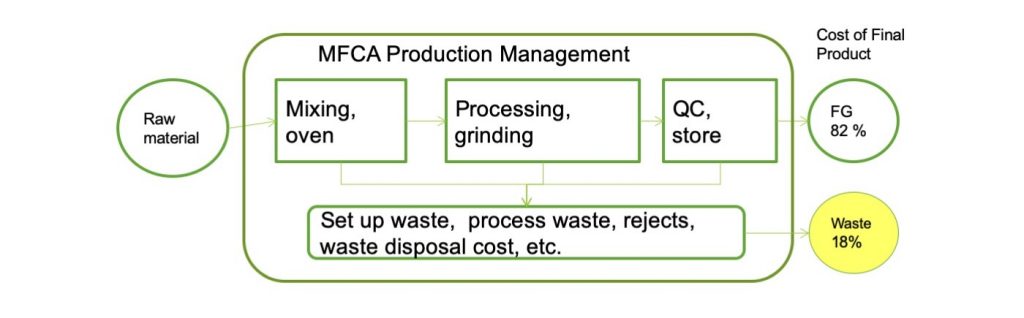
Figure 6. MFCA-based cost calculation applied in Company A revealed that a surprisingly high monetary amount of waste was generated.
However, when MFCA analysis based on cost was conducted instead of simply counting the number of defective products, the waste volume accounted for 18% of total input costs (Figure 6.) That figure came as a surprise to the management team of Company A and it was agreed that immediate countermeasures were needed.
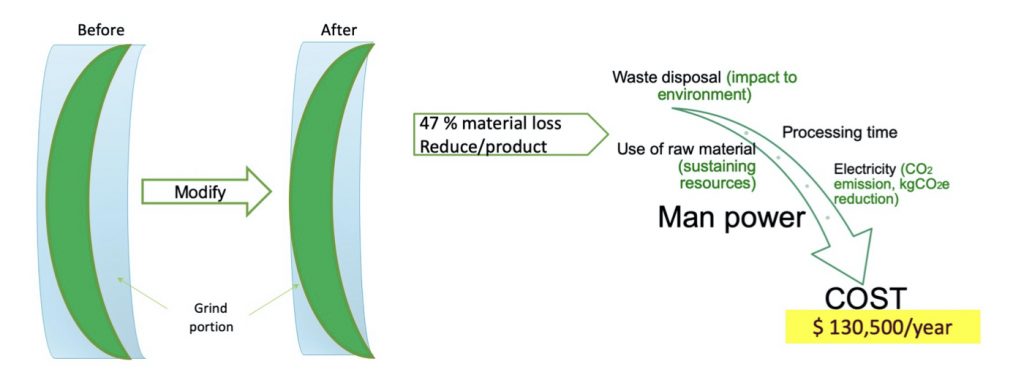
Figure 7. Results of a countermeasure put in place by Company A after MFCA analysis.
As one of the countermeasures taken, Company A modified a product mold to produce a “near-shape” semifinished piece that was thinner than the previous one. Thinner pieces require less material, use less time and electricity for grinding, and generate less waste. The modified mold reduce reduced grind thickness from 1.5 mm to 0.8 mm, for a 47% reduction in material loss and monetary savings of USD130,500 annually (Figure 7). Another benefit was lower environmental impact with less electricity use and a reduction in the carbon dioxide equivalent (an important environmental impact measurement indicator) in the production process.
Example 2
The 5-star Hotel B adopted MFCA in its laundry department to identify potential areas for improvement. The MFCA flow model visualized water use in association with the high volume of energy expended. The high energy cost was shown to justify the use of additional chemicals that enable the use of low-temperature wash cycles. The resulting 40% savings in water and electricity contributed to lowering both environmental impact and laundry costs (Figure 8).
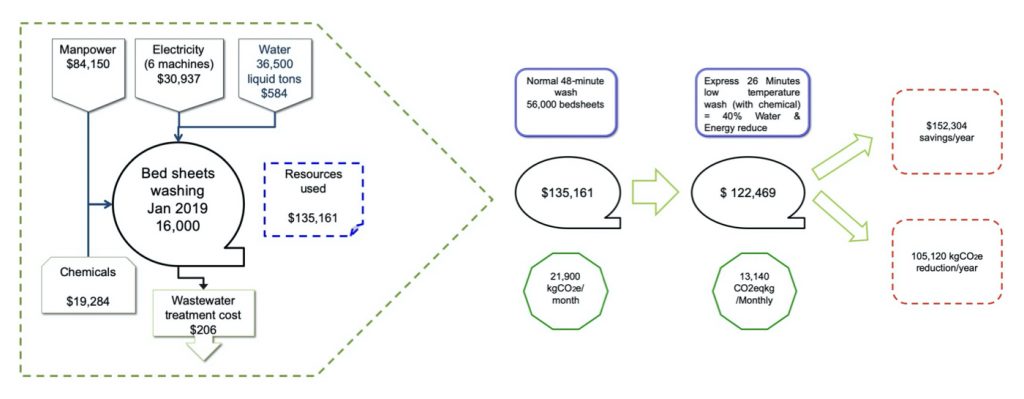
Figure 8. Savings achieved in the laundry facilities of Hotel B after MFCA analysis.
Example 3
Company C is a contract manufacturer of various types of consumer products. The company decided to introduce MFCA to its three main suppliers of plastic containers to improve overall performance. Initial MFCA analysis indicated an average overall positive-to-negative product ratio of 85:15 among the suppliers (Figure 9). However, each supplier had its own key advantages in selected processes with different levels of waste produced.
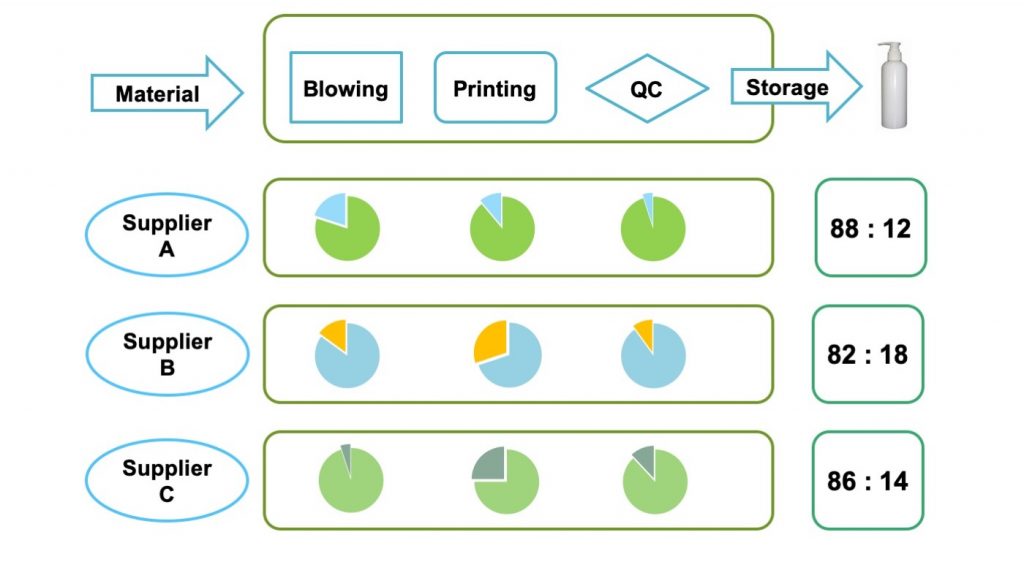
Figure 9. Positive-to-negative product ratios of three main suppliers of Company C before MFCA.
Company C coordinated a joint improvement benchmarking project among the three suppliers to enhance selected process performance by learning from the best process owners (e.g., Suppliers A and B benchmarked against the best blowing process used by Supplier C, Suppliers B and C benchmarked against the best printing process used by Supplier A, etc.).
All three selected suppliers demonstrated improvement in both productivity and environmental performance. Notably, the overall positive-to-negative product ratio increased significantly to an average 92:8 (Figure 10).
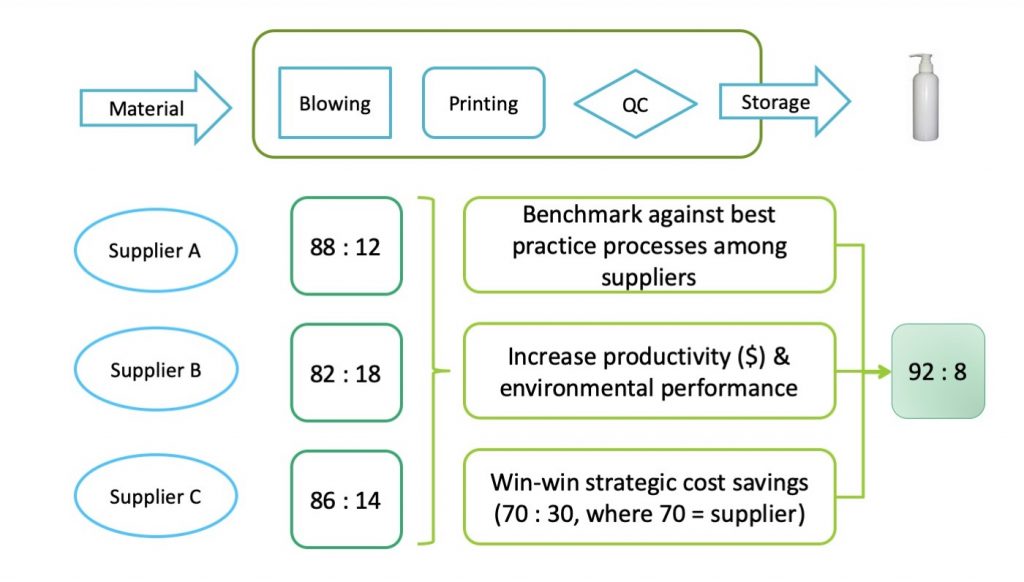
Figure 10. Improvement achieved in Company C’s suppliers after a joint MFCA-based benchmarking effort.
Conclusion
MFCA has repeatedly been proven to assist organizations in clearly visualizing the flow of resources. It results in interlinked improvements in both environmental and cost performance, despite limitations in data availability and lack of experience in calculations. It is important to remember that continual improvement initiatives for organizations of all sizes should start by visualizing the flow of total resources before determining a specific area to tackle first. Both the traditional and simplified versions of MFCA provide comprehensive information on the cost of waste, which creates awareness and motivation for organizations, especially SMEs, to launch improvement efforts.
Alex Yap is the expert for the APO e-learning course on Integrating Lean Manufacturing Systems and Industry 4.0 Concepts. Course description is available here.

Alex Yap has more than 15 years of manufacturing experience as a quality assurance manager. He is a registered consultant with the Malaysia Productivity Corporation, a business excellence assessor, and productivity specialist in the areas of process improvement and performance excellence. Alex also served as a technical expert for various APO Green Productivity, lean, and material flow cost accounting courses.