Select Page
Flow chart
A flow chart is one of the seven basic tools of quality control, which include the histogram, Pareto chart, check sheet, control chart, cause-and-effect diagram, and scatter diagram. A flow […]
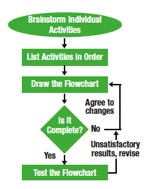
A flow chart is one of the seven basic tools of quality control, which include the histogram, Pareto chart, check sheet, control chart, cause-and-effect diagram, and scatter diagram. A flow chart is a graphic method of representing activities or decision processes and illustrating how all the steps in a process link together to enable work. By definition, a flow chart presents the sequence of activities as well as the function of the activities, e.g., information collection, analysis, operation, decisionmaking, etc. A flow chart allows all relevant processes to be consolidated, along with the identification of gaps, duplication, and dead ends. It facilitates process simplification. As very large process diagrams are hard to validate and control, they can be split into smaller levels. Care must be taken to keep elements of the chart at the same level of detail (see accompanying figure).
Flow charts are a useful standardized communication tool. They are commonly used as visual aids tied to work instructions and other on-the-floor documents. They are very flexible and easy to use as an input into a project or as a visual depiction of the project itself.