Select Page
Scatter diagram
The scatter diagram is one of the seven basic tools of quality control, which include the histogram, Pareto chart, check sheet, control chart, cause-and-effect diagram, and flow chart. Scatter diagrams show the relationship between two variables. They are basically a graphic tool depicting the influence that one variable has on another. A common diagram of this type usually displays points representing the observed value of one variable corresponding to the value of another variable. The scatter diagram is a very broad picture of the relationship and will only help to confirm that a relationship exists and how strong it is. It provides a visual and statistical test of how strong or weak the relationship is (see accompanying figure). The stronger the tie or dependency, the greater the likelihood that a change in one will impact the other. A scatter diagram is very useful when it is necessary to adjust the value of a variable but one is not sure of the effects of this variable on the other.
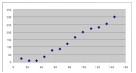 Strong Correlation |
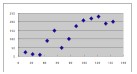 Moderate Correlation |
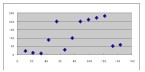 Weak Correlation |